The S&P 500 is on track for another double-digit gain this year.
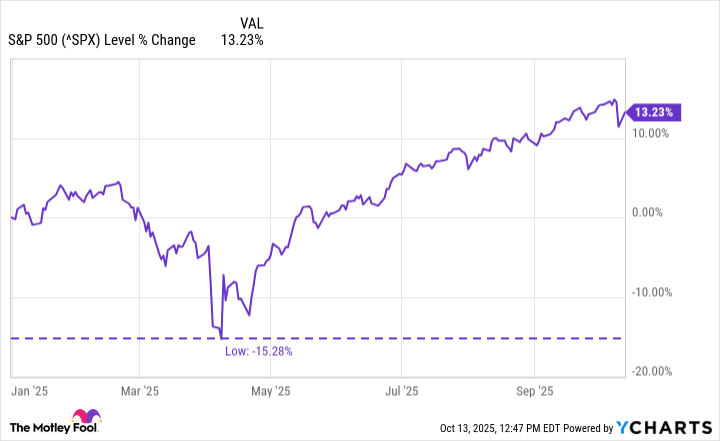
The stock market spent much of 2025 defying both gravity and logic. Despite persistent geopolitical tensions in Europe and the Middle East, new tariffs, and uncertainty over the timing of Federal Reserve policy decisions, the S&P 500 is up about 13% year-to-date at press time (October 13). But these headline numbers don’t capture all the drama beneath the surface.
The year started on an optimistic note, driven by accelerated investment in artificial intelligence (AI). But the rally was marred by chaos in April when President Trump announced “Emancipation Day” tariffs, a move that briefly shook confidence on Wall Street and spooked retail investors. But since bottoming in mid-April, the S&P 500 index has risen more than 20%, a strong rebound that reignited the bull market.
^SPX data by YCharts
If current momentum is maintained through the end of the year, 2025 will be the third consecutive year of double-digit growth. Such sequences are extremely rare. Over the past century, the index has experienced consecutive annual increases of more than 20% in just four different eras: the 1920s, 1930s, 1950s, and 1990s. While each of these periods produced vast amounts of wealth, they also produced painful lessons, reminding investors that history’s verdict on a sustained bull market is never clear.
Echoes of history: 40 years, 4 results
The 1920s marked America’s first great consumer boom, fueled by rapid industrialization, easy credit, and cultural acceptance of modernity. With this confidence in endless prosperity, the market soared. But as euphoria turned to speculation, valuations drifted away from reality, and the crash of 1929 quickly eroded a decade’s worth of optimism and ushered in the Great Depression.
The 1930s told a very different story. From 1935 to 1936, the S&P 500 index soared a cumulative 69%, only to plummet 38% the following year and rebound 25% in 1938. These notable fluctuations reflected an era defined by economic despair, where bouts of optimism were often replaced by renewed fear. Investors regularly bet on economic recovery, but these gains were fragile and temporary. Essentially, this decade was marked by instability rather than triumph.
In contrast, the 1950s brought real and sustained prosperity. In 1954 and 1955, the S&P 500 rose 45% and 26%, respectively. Unlike previous economic booms, this post-World War II expansion was not driven by speculation but by the rise of a middle-class economy and peacetime stability.
Then the 1990s arrived. This era is very similar to today’s AI-driven market. The Internet has revolutionized commerce, communication, and culture, and propelled stocks into a new stratosphere. But this excitement eventually gave rise to the dot-com bubble, and its collapse in 2000 wiped out trillions of dollars of paper wealth overnight.
Are we in the middle of a bubble or a generational breakthrough?
The current market rally is at the intersection of history’s well-known patterns. Meanwhile, the AI revolution has become the defining investment theme of this generation. Semiconductor, data center, cloud computing, and even nuclear stocks led the charge, changing balance sheets and investor expectations in the process.
Skeptics warn that the AI hype is doomed to repeat the hype of 1999, as valuations become frothy. But calling today’s market a bubble ignores an important nuance. In other words, AI is not a temporary trend. Rather, it could be the beginning of a structural change with lasting economic consequences. It’s more like the advent of electricity and the internet than a momentary story-driven craze.
This reality makes it virtually impossible to predict the path forward. There’s a good chance the market will cool as earnings growth catches up with investors’ high expectations. Or it could kick into gear if AI productivity improvements begin to significantly increase global output.
Either way, this cycle embodies the familiar combination of genuine innovation sprinkled with speculative excitement, a combination that has characterized every great era of progress in market history.
Investment lessons that history always confirms
Trying to predict when the market will soar or when it will fall is an exercise in false precision. A more reliable approach is to own high-quality businesses led by capable management teams, weather periods of volatility, and steadily add winners while cutting out laggards.
History does not provide precise strategies, but one lesson is surprisingly clear. That said, the S&P 500 rewards patience. Markets have endured wars, recessions, bubbles, and crashes. But over the long term, the S&P 500 Index has compounded gains of about 7% per year, after adjusting for inflation.
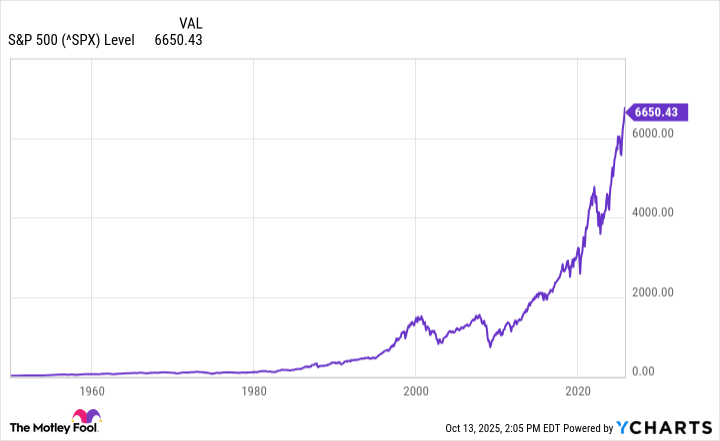
^SPX data by YCharts
Stock markets can lose direction for years at a time, but always find direction again. Through a century of panic, policy shifts, and economic turmoil, one truth remains the same. That is, a characteristic of markets is resilience.
Adam Spatako has no position in any stocks mentioned. The Motley Fool has no position in any stocks mentioned. The Motley Fool has a disclosure policy.
The Motley Fool is a USA TODAY content partner providing financial news, analysis and commentary designed to help people take control of their financial lives. Its content is produced independently of USA TODAY.

